Initialization
The driver must be initialized by calling ::zetInit after calling ::zeInit and before calling any other experimental function. Simultaneous calls to ::zetInit are thread-safe.
API Tracing
Introduction
API tracing provides a way for tools to recieve notifications of API calls made by an applicaton. The callbacks provide direct access to the input and output parameters for viewing and modification. Tools may also use these notifications as triggers to block and inject new API calls into the command stream, such as metrics.
Registration
Tools may independently register for enter and exist callbacks for individual API calls, per driver instance.
::zetTracerSetPrologues is used to specify all the enter callbacks
::zetTracerSetEpilogues is used to specify all the exist callbacks
If the value of a callback is nullptr, then it will be ignored.
The callbacks are defined as a collection of per-API function pointers, with the following parameters:
params : a structure capturing pointers to the input and output parameters of the current instance
result : the current value of the return value
pTracerUserData : the user’s pointer for the tracer’s data
ppTracerInstanceUserData : a per-tracer, per-instance storage location; typically used for passing data from the prologue to the epilogue
Note: since the creation of a tracer requires a device, on first glance it appears that ::zeInit, ::zeDriverGet and ::zeDeviceGet are not traceable. However, these APIs are traceable for all calls subsequent from the creation and enabling of the tracer itself.
Enabling/Disabling and Destruction
The tracer is created in a disabled state and must be explicitly enabled by calling ::zetTracerSetEnabled. The implementation guaranteed that prologues and epilogues will always be executed in pairs; i.e.
if the prologue was called then the epilogue is guaranteed to be called, even if another thread disabled the tracer between execution
if the prologue was not called then the epilogue is guaranteed not to be called, even if another thread enabled the tracer between execution
The tracer should be disabled by the application before the tracer is destoryed. If multiple threads are in-flight, then it is still possbile that callbacks will continue to execute even after the tracer is disabled; specifically due to the pairing rules above. Due to the complexity involved in ensuring no threads are still or will be executing a callback even after its been disabled, the implementation will stall and wait for any outstanding threads during ::zetTracerDestroy.
The following pseudo-code demonstrates a basic usage of API tracing:
typedef struct _my_tracer_data_t
{
    uint32_t instance;
} my_tracer_data_t;

typedef struct _my_instance_data_t
{
    clock_t start;
} my_instance_data_t;

void OnEnterCommandListAppendLaunchKernel(
    ze_command_list_append_launch_function_params_t* params,
    ze_result_t result,
    void* pTracerUserData,
    void** ppTracerInstanceUserData )
{
    my_instance_data_t* instance_data = malloc( sizeof(my_instance_data_t) );
    *ppTracerInstanceUserData = instance_data;

    instance_data->start = clock();
}

void OnExitCommandListAppendLaunchKernel(
    ze_command_list_append_launch_function_params_t* params,
    ze_result_t result,
    void* pTracerUserData,
    void** ppTracerInstanceUserData )
{
    clock_t end = clock();

    my_tracer_data_t* tracer_data = (my_tracer_data_t*)pTracerUserData;
    my_instance_data_t* instance_data = *(my_instance_data_t**)ppTracerInstanceUserData;

    float time = 1000.f * ( end - instance_data->start ) / CLOCKS_PER_SEC;
    printf("zeCommandListAppendLaunchKernel #%d takes %.4f ms\n", tracer_data->instance++, time);

    free(instance_data);
}

void TracingExample( ... )
{
    my_tracer_data_t tracer_data = {};
    zet_tracer_desc_t tracer_desc;
    tracer_desc.version = ZET_TRACER_DESC_VERSION_CURRENT;
    tracer_desc.pUserData = &tracer_data;
    zet_tracer_handle_t hTracer;
    zetTracerCreate(hDevice, &tracer_desc, &hTracer);

    // Set all callbacks
    zet_core_callbacks_t prologCbs = {};
    zet_core_callbacks_t epilogCbs = {};
    prologCbs.CommandList.pfnAppendLaunchFunction = OnEnterCommandListAppendLaunchKernel;
    epilogCbs.CommandList.pfnAppendLaunchFunction = OnExitCommandListAppendLaunchKernel;

    zetTracerSetPrologues(hTracer, &prologCbs);
    zetTracerSetEpilogues(hTracer, &epilogCbs);

    zetTracerSetEnabled(hTracer, true);

    zeCommandListAppendLaunchKernel(hCommandList, hFunction, &launchArgs, nullptr, 0, nullptr);
    zeCommandListAppendLaunchKernel(hCommandList, hFunction, &launchArgs, nullptr, 0, nullptr);
    zeCommandListAppendLaunchKernel(hCommandList, hFunction, &launchArgs, nullptr, 0, nullptr);

    zetTracerSetEnabled(hTracer, false);
    zetTracerDestroy(hTracer);
}
Metrics
Introduction
Devices provide programmable infrastructure designed to support performance debugging. The API described in this document provides access to these device metrics.
Most of the detailed metrics require the device to be properly programmed before use. It is important to understand that the device programming is in most cases global. This generally means that if a software tool or an application is using the metrics then no other application can reliably use the same device resources.
The use of some metrics may negatively impact the performance of the device. The intention of this API is to support performance debug and it is not advised to use it in regular execution.
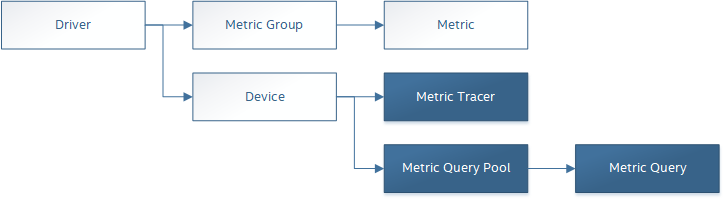
Metric Groups
The device infrastucture consists of non-programmable, pre-defined set of counters, and a programmable network of connections that work with a separate set of counters as well as other types of counters. For sake of simplicity, the smallest unit of configuration is a Metric Group. Metric Groups are sets of metrics that provide certain perspective on workload’s performance. The groups aggregate metrics, define device programming and available collection methods. An application may choose to collect data from a number of Metric Groups provided that they all belong to different domains. Domains are used as a software representation of independent device resources that can safely be used concurrently.
Sampling Types
Sampling types are a software representation of device capabilities in terms of reading metric values. Each Metric Group provides information which sampling types it supports. There are separate sets of APIs supporting each of the sampling types Time-based and Event-based.
All available sampling types are defined in ::zet_metric_group_sampling_type_t.
Information about supported sampling types for a given Metric Group is provided in ::zet_metric_group_properties_t.samplingType.
It’s possible that a device provides multiple Metric Groups with the same names but different sampling types.
When enumerating, it’s important to choose a Metric Group which supports the desired sampling type.
Domains
Every Metric Group belongs to a given domain (::zet_metric_group_properties_t.domain).
The Metric Group typically define a uniform device counter configuration used for measurements.
Each domain represents an exclusive resource used by the Metric Group.
It’s possible to simultaneously gather data for two different Metric Groups, only if they belong to a different domain i.e. Metric Groups that can be collected concurrently will have different domain values.
Enumeration
All available metrics are organized into Metric Groups.
During data collection, data for the whole Metric Group is gathered.
The list of available Metric Groups and their Metrics is device-specific.
The following APIs provide all the information needed for identification and usage.
Metric Group properties are accessed through function ::zetMetricGroupGetProperties, returning ::zet_metric_group_properties_t.
Metric properties are accessed through function ::zetMetricGetProperties, returning ::zet_metric_properties_t.
A common tool flow is to enumerate metrics looking for a specific Metric Group. Depending on the metrics required for a specific scenario a tool may choose to run the workload multiple times, recording different set of Metric Groups each time. Usually care must be taken to ensure run-to-run stability and result repeatability if metrics from different runs are meant to be used together. When enumerating Metric tree to find a desired Metric Group, it’s important to know in advance which sampling type it will be used.
To enumerate through the Metric tree:
Call ::zetMetricGroupGet to obtain Metric Group count.
Call ::zetMetricGroupGet to obtain all Metric Groups.
Iterate over all available Metric Groups.
At this point it’s possible to check e.g. Metric Group name, domain or sampling type.
Metric Group names may not be unique.
For each Metric Group obtain their Metric count calling ::zetMetricGroupGetProperties with Metric Group handle (::zet_metric_group_handle_t) and checking zet_metric_group_properties_t.metricCount.
Iterate over available Metrics using ::zetMetricGet with parent Metric Group (::zet_metric_group_handle_t).
Check Metric properties (e.g. name, description) calling ::zetMetricGetProperties with parent Metric (::zet_metric_handle_t).
The following pseudo-code demonstrates a basic enumeration over all available metric groups and their metrics. Additionally, it returns a metric group with a chosen name and sampling type. Similar code could be used for selecting a preferred metric group for a specific type of measurements.
ze_result_t FindMetricGroup( ze_device_handle_t hDevice,
                               char* pMetricGroupName,
                               uint32_t desiredSamplingType,
                               zet_metric_group_handle_t* phMetricGroup )
{
    // Obtain available metric groups for the specific device
    uint32_t metricGroupCount = 0;
    zetMetricGroupGet( hDevice, &metricGroupCount, nullptr );

    zet_metric_group_handle_t* phMetricGroups = malloc(metricGroupCount * sizeof(zet_metric_group_handle_t));
    zetMetricGroupGet( hDevice, &metricGroupCount, phMetricGroups );

    // Iterate over all metric groups available
    for( i = 0; i < metricGroupCount; i++ )
    {
        // Get metric group under index 'i' and its properties
        zet_metric_group_properties_t metricGroupProperties;
        zetMetricGroupGetProperties( phMetricGroups[i], &metricGroupProperties );

        printf("Metric Group: %s\n", metricGroupProperties.name);

        // Check whether the obtained metric group supports the desired sampling type
        if((metricGroupProperties.samplingType & desiredSamplingType) == desiredSamplingType)
        {
            // Check whether the obtained metric group has the desired name
            if( strcmp( pMetricGroupName, metricGroupProperties.name ) == 0 )
            {
                *phMetricGroup = phMetricGroups[i];
                break;
            }
        }
    }

    free(phMetricGroups);
}
Configuration
Use the ::zetDeviceActivateMetricGroups API call to configure the device for data collection.
Subsequent calls to the function will disable device programming for the metric groups not selected for activation.
To avoid undefined results only call the ::zetDeviceActivateMetricGroups between experiments i.e. while not collecting data.
Programming restrictions:
Any combination of metric groups can be configured simultaneously provided that all of them have different ::zet_metric_group_properties_t.domain.
MetricGroup must be active until ::zetMetricQueryGetData and ::zetMetricTracerClose.
Conflicting Groups cannot be activated, in such case the call to ::zetDeviceActivateMetricGroups would fail.
Collection
There are two modes of metrics collection supported: time-based and event-based.
Time-based collection is using a timer as well as other events to store data samples. A metric tracer interface is the software interface for configuration and collection.
Event-based metrics collection is based on a pair of Begin/End events appended to command lists. A metric query interface is the software interface for configuration and collection.
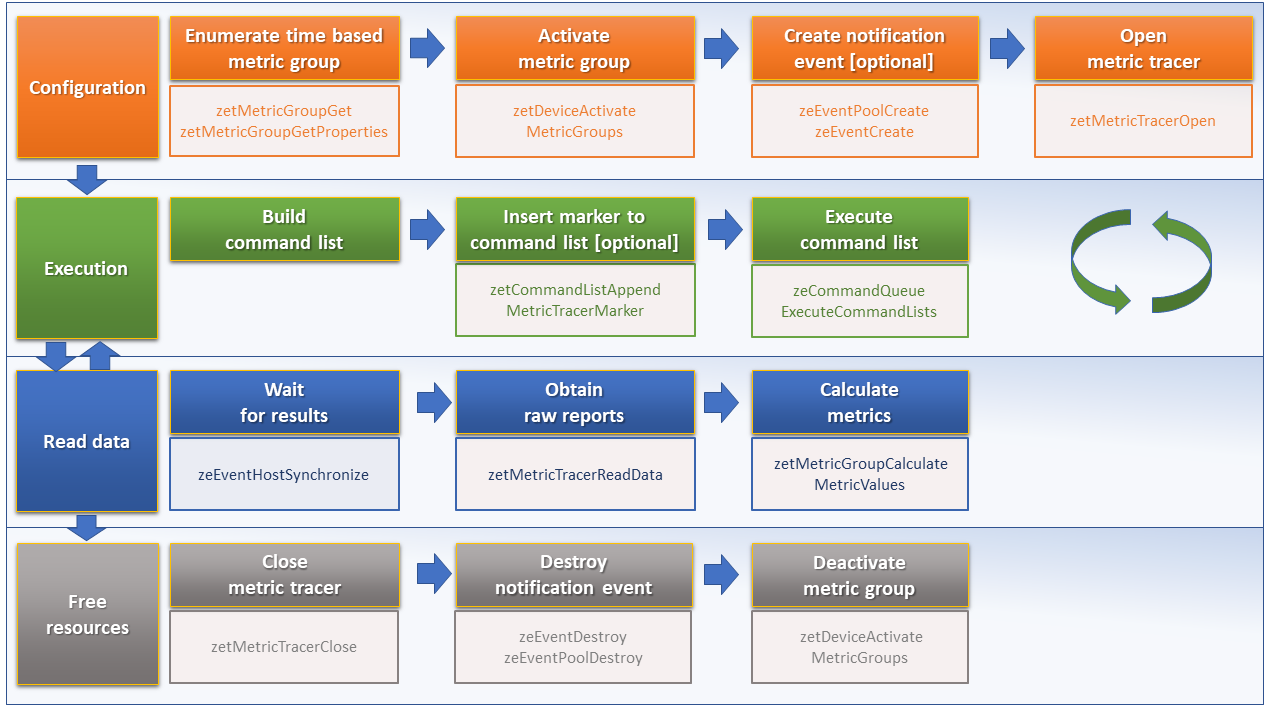
Metric Tracer
Time-based collection uses a simple Open, Wait, Read, Close scheme: - ::zetMetricTracerOpen opens the tracer. - ::zeEventHostSynchronize and ::zeEventQueryStatus can be used to wait for data. - ::zetMetricTracerReadData reads the data to be later processed by ::zetMetricGroupCalculateMetricValues. - ::zetMetricTracerClose closes the tracer.
The following pseudo-code demonstrates a basic sequence for tracer-based collection:
ze_result_t TimeBasedUsageExample( ze_driver_handle_t hDriver,
                                     ze_device_handle_t hDevice )
{
    zet_metric_group_handle_t     hMetricGroup           = nullptr;
    ze_event_handle_t            hNotificationEvent     = nullptr;
    ze_event_pool_handle_t       hEventPool             = nullptr;
    ze_event_pool_desc_t         eventPoolDesc          = {ZE_EVENT_POOL_DESC_VERSION_CURRENT, ZE_EVENT_POOL_FLAG_DEFAULT , 1};
    ze_event_desc_t              eventDesc              = {ZE_EVENT_DESC_VERSION_CURRENT};
    zet_metric_tracer_handle_t    hMetricTracer          = nullptr;
    zet_metric_tracer_desc_t      metricTracerDescriptor = {ZET_METRIC_TRACER_DESC_VERSION_CURRENT};

    // Find a "ComputeBasic" metric group suitable for Time Based collection
    FindMetricGroup( hDevice, "ComputeBasic", ZET_METRIC_GROUP_SAMPLING_TYPE_TIME_BASED, &hMetricGroup );

    // Configure the HW
    zetDeviceActivateMetricGroups( hDevice, 1 /* count */, &hMetricGroup );

    // Create notification event
    zeEventPoolCreate( hDriver, &eventPoolDesc, 1, &hDevice, &hEventPool );
    eventDesc.index  = 0;
    eventDesc.signal = XE_EVENT_SCOPE_FLAG_HOST;
    eventDesc.wait   = XE_EVENT_SCOPE_FLAG_HOST;
    zeEventCreate( hEventPool, &eventDesc, &hNotificationEvent );

    // Open metric tracer
    metricTracerDescriptor.samplingPeriod       = 1000;
    metricTracerDescriptor.notifyEveryNReports  = 32768;
    zetMetricTracerOpen( hDevice, hMetricGroup, &metricTracerDescriptor, hNotificationEvent, &hMetricTracer );

    // Run your workload, in this example we assume the data for the whole experiment fits in the device buffer
    Workload(hDevice);
    // Optionally insert markers during workload execution
    //zetCommandListAppendMetricTracerMarker( hCommandList, hMetricTracer, tool_marker_value );

    // Wait for data, optional in this example since the whole workload has already been executed by now
    //zeEventHostSynchronize( hNotificationEvent, 1000 /*timeout*/ );
    // reset the event if it fired

    // Read raw data
    size_t rawSize = 0;
    zetMetricTracerReadData( hMetricTracer, UINT32_MAX, &rawSize, nullptr );
    uint8_t* rawData = malloc(rawSize);
    zetMetricTracerReadData( hMetricTracer, UINT32_MAX, &rawSize, rawData );

    // Close metric tracer
    zetMetricTracerClose( hMetricTracer );
    zeEventDestroy( hNotificationEvent );
    zeEventPoolDestroy( hEventPool );

    // Deconfigure the device
    zetDeviceActivateMetricGroups( hDevice, 0, nullptr );

    // Calculate metric data
    CalculateMetricsExample( hMetricGroup, rawSize, rawData );
    free(rawData);
}
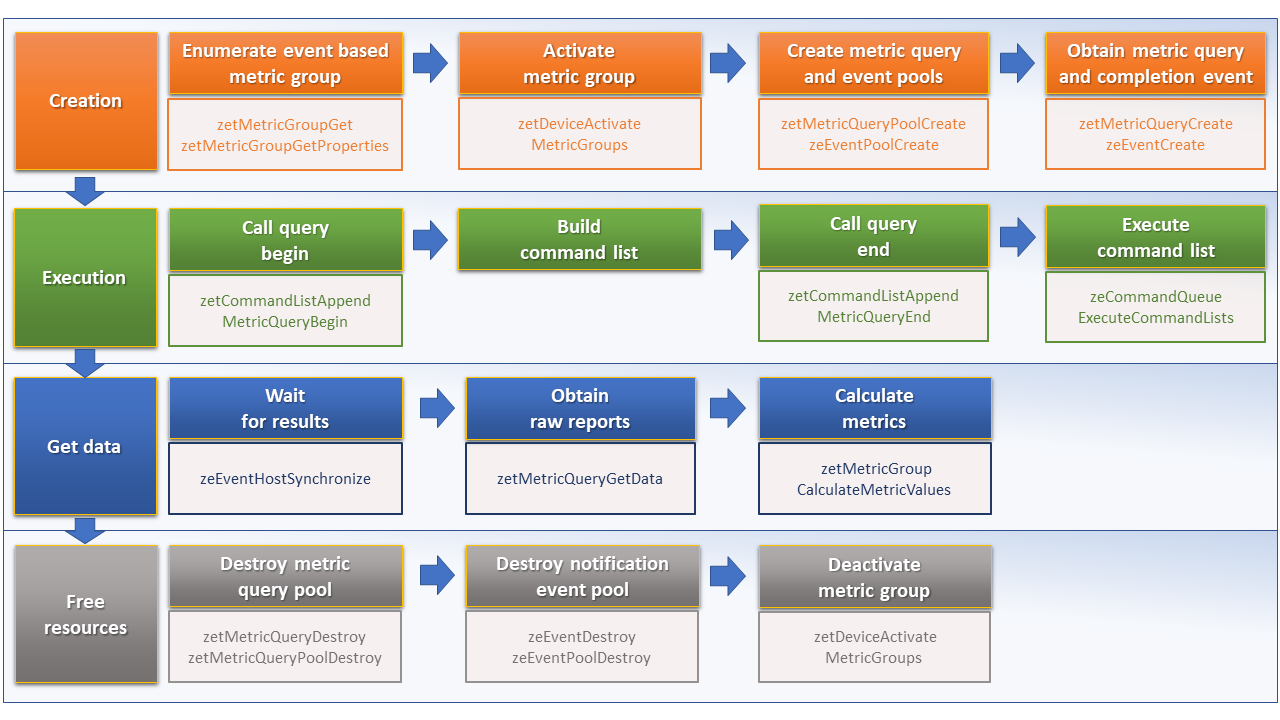
Metric Query
Event-based collection uses a simple Begin, End, GetData scheme:
::zetCommandListAppendMetricQueryBegin defines the start counting event
::zetCommandListAppendMetricQueryEnd defines the finish counting event
::zetMetricQueryGetData reads the raw data to be later processed by ::zetMetricGroupCalculateMetricValues.
Typically, multiple queries are used and recycled to characterize a workload. A Query Pool is used to efficiently use and reuse device memory for multiple queries.
::zetMetricQueryPoolCreate creates a pool of homogeneous queries.
::zetMetricQueryPoolDestroy frees the pool. The application must ensure no queries within the pool are in-use before freeing the pool.
::zetMetricQueryCreate obtains a handle to a unique location in the pool.
::zetMetricQueryReset allows for low-cost recycling of a location in the pool.
The following pseudo-code demonstrates a basic sequence for query-based collection:
ze_result_t MetricQueryUsageExample( ze_driver_handle_t hDriver,
                                       ze_device_handle_t hDevice )
{
    zet_metric_group_handle_t      hMetricGroup          = nullptr;
    ze_event_handle_t             hCompletionEvent      = nullptr;
    ze_event_pool_desc_t          eventPoolDesc         = {ZE_EVENT_POOL_DESC_VERSION_CURRENT};
    ze_event_desc_t               eventDesc             = {ZE_EVENT_DESC_VERSION_CURRENT};
    ze_event_pool_handle_t        hEventPool            = nullptr;
    zet_metric_query_pool_handle_t hMetricQueryPool      = nullptr;
    zet_metric_query_handle_t      hMetricQuery          = nullptr;
    zet_metric_query_pool_desc_t   queryPoolDesc         = {ZET_METRIC_QUERY_POOL_DESC_VERSION_CURRENT};

    // Find a "ComputeBasic" metric group suitable for Event Based collection
    FindMetricGroup( hDevice, "ComputeBasic", ZET_METRIC_GROUP_SAMPLING_TYPE_EVENT_BASED, &hMetricGroup );

    // Configure HW
    zetDeviceActivateMetricGroups( hDevice, 1 /* count */, &hMetricGroup );

    // Create metric query pool & completion event
    queryPoolDesc.flags        = ZET_METRIC_QUERY_POOL_FLAG_PERFORMANCE;
    queryPoolDesc.count        = 1000;
    zetMetricQueryPoolCreate( hDevice, hMetricGroup, &queryPoolDesc, &hMetricQueryPool );
    eventPoolDesc.flags = ZE_EVENT_POOL_FLAG_DEFAULT;
    eventPoolDesc.count = 1000;
    zeEventPoolCreate( hDriver, &eventPoolDesc, 1, &hDevice, &hEventPool );

    // Write BEGIN metric query to command list
    zetMetricQueryCreate( hMetricQueryPool, 0 /*slot*/, &hMetricQuery );
    zetCommandListAppendMetricQueryBegin( hCommandList, hMetricQuery );

    // build your command list

    // Write END metric query to command list, use an event to determine if the data is available
    eventDesc.index  = 0;
    eventDesc.signal = XE_EVENT_SCOPE_FLAG_HOST;
    eventDesc.wait   = XE_EVENT_SCOPE_FLAG_HOST;
    zeEventCreate( hEventPool, &eventDesc, &hCompletionEvent);
    zetCommandListAppendMetricQueryEnd( hCommandList, hMetricQuery, hCompletionEvent );

    // use zeCommandQueueExecuteCommandLists( , , , ) to submit your workload to the device

    // Wait for data
    zeEventHostSynchronize( hCompletionEvent, 1000 /*timeout*/ );

    // Read raw data
    size_t rawSize = 0;
    zetMetricQueryGetData( hMetricQuery, &rawSize, nullptr );
    uint8_t* rawData = malloc(rawSize);
    zetMetricQueryGetData( hMetricQuery, &rawSize, rawData );

    // Free the resources
    zeEventDestroy( hCompletionEvent );
    zeEventPoolDestroy( hEventPool );
    zetMetricQueryPoolDestroy( hMetricQueryPool );

    // Deconfigure HW
    zetDeviceActivateMetricGroups( hDevice, 0, nullptr );

    // Calculate metric data
    CalculateMetricsExample( hMetricGroup, rawSize, rawData );
    free(rawData);
}
Calculation
Both MetricTracer and MetricQueryPool collect the data in device specific, raw form that is not suitable for application processing. To calculate metric values use ::zetMetricGroupCalculateMetricValues.
The following pseudo-code demonstrates a basic sequence for metric calculation and interpretation:
ze_result_t CalculateMetricsExample( zet_metric_group_handle_t hMetricGroup,
                                       size_t rawSize, uint8_t* rawData )
{
    // Calculate metric data
    uint32_t numMetricValues = 0;
    zetMetricGroupCalculateMetricValues( hMetricGroup, rawSize, rawData, &numMetricValues, nullptr );
    zet_typed_value_t* metricValues = malloc( numMetricValues * sizeof(zet_typed_value_t) );
    zetMetricGroupCalculateMetricValues( hMetricGroup, rawSize, rawData, &numMetricValues, metricValues );

    // Obtain available metrics for the specific metric group
    uint32_t metricCount = 0;
    zetMetricGet( hMetricGroup, &metricCount, nullptr );

    zet_metric_handle_t* phMetrics = malloc(metricCount * sizeof(zet_metric_handle_t));
    zetMetricGet( hMetricGroup, &metricCount, phMetrics );

    // Print metric results
    uint32_t numReports = numMetricValues / metricCount;
    for( uint32_t report = 0; report < numReports; ++report )
    {
        printf("Report: %d\n", report);

        for( uint32_t metric = 0; metric < metricCount; ++metric )
        {
            zet_typed_value_t data = metricValues[report * metricCount + metric];

            zet_metric_properties_t metricProperties;
            zetMetricGetProperties( phMetrics[ metric ], &metricProperties );

            printf("Metric: %s\n", metricProperties.name );

            switch( data.type )
            {
            case ZET_VALUE_TYPE_UINT32:
                printf(" Value: %lu\n", data.value.ui32 );
                break;
            case ZET_VALUE_TYPE_UINT64:
                printf(" Value: %llu\n", data.value.ui64 );
                break;
            case ZET_VALUE_TYPE_FLOAT32:
                printf(" Value: %f\n", data.value.fp32 );
                break;
            case ZET_VALUE_TYPE_FLOAT64:
                printf(" Value: %f\n", data.value.fp64 );
                break;
            case ZET_VALUE_TYPE_BOOL8:
                if( data.value.ui32 )
                    printf(" Value: true\n" );
                else
                    printf(" Value: false\n" );
                break;
            default:
                break;
            };
        }
    }

    free(metricValues);
    free(phMetrics);
}
Program Instrumentation
Introduction
The program instrumentation APIs provide tools a basic framework for low-level profiling of device programs, by allowing direct instrumentation of those programs. These capabilities, in combination with those already provided, in combination with API tracing, are sufficient for more advanced frameworks to be developed independently.
There are two type of instrumentation available:
Inter-Function Instrumentation - intercepting and redirecting function calls
Intra-Function Instrumentation - injecting new instructions within a function
Inter-Function Instrumentation
The following capabilities allow for a tool to intercept and redirect function calls:
Inter-module function calls - the ability to call functions between different modules; e.g., the application’s module and a tool’s module
For example, a tool may use API Tracing in any of the following ways:
::zeModuleCreate - replace a module handle with instrumented module handle for all functions
::zeKernelCreate - replace a kernel handle with instrumented kernel handle for all call sites
::zeModuleGetFunctionPointer - replace a function pointer with instrumented function pointer for all call sites
::zeCommandListAppendLaunchKernel - replace a kernel handle with instrumented kernel handle at call site
Intra-Function Instrumentation
The following capabilities allow for a tool to inject instructions within a kernel:
::zetModuleGetDebugInfo - allows a tool to query standard debug info for an application’s module
::zetKernelGetProfileInfo - allows a tool query detailed information on aspects of a kernel
::zeModuleGetNativeBinary - allows for a tool to retrieve the native binary of the application’s module, instrument it, then create a new module using the intrumented version
API-Tracing - same usage as Inter-Function Instrumentation above
Compilation
A module must be compiled with foreknowledge that instrumentation will be performed in order for the compiler to generate the proper profiling meta-data. Therefore, when the instrumentation layer is enabled, a new build flag is supported: “-zet-profile-flags”, where “” must be a combination of ::zet_profile_flag_t, in hexidecimal.
As an example, a tool could use API Tracing to inject this build flag on each ::zeModuleCreate call that the tool wishes to instrument. In another example, a tool could recompile a Module using the build flag and use API Tracing to replace the application’s Module handle with it’s own.
Instrumentation
Once the module has been compiled with instrumentation enabled, a tool may use ::zetModuleGetDebugInfo and ::zetKernelGetProfileInfo in order to decode the application’s instructions and register usage for each function in the module.
If a tool requires additional functions to be used, it may create other module(s) and use ::zeModuleGetFunctionPointer to call functions between the application and tool modules. A tool may use ::zeModuleGetFunctionPointer to retrieve the Host and device address of each function in the module.
There are no APIs provided for the actual instrumentation. Instead this is left up to the tool itself to decode the application module’s native binary and inject native instructions. This model prevents the instrumentation from being manipulated by the compiler.
Execution
If a tool requires changing the address of an application’s function, then it should use API Tracing; for example, ::zeModuleGetFunctionPointer and all flavors of ::zeCommandListAppendLaunchKernel.